Spatial Rainfall Variability
How variable is the rainfall in Shepparton, and why is that importantQuality, time varying rainfall data is one of the key inputs for hydrologic model calibration or verification. Without this data it is impossible to use the model to compare the observed wet weather operation of the system to the operation expected by a sewerage model.
In 2023 UWS invested in a handful of rain gauges and NB-IoT communicating data loggers and four of these units were installed around the regional Victorian township of Shepparton.
Rain gauges were well distributed across the area and installed at four secure sites:
- RG01 at Wanganui Road (north),
- RG02 at the Shepparton Water Treatment Plant (west),
- RG03 at GVW Operations Centre (east), and
- RG04 at Kialla Raceway (south).
The Bureau of Meteorology (BOM) also has a rain gauge at Shepparton Airport (Station 081125), located close to RG04.
Figure 1 shows the rain gauge locations on a map.

Rainfall in Shepparton
On 2 January 2024, Shepparton experienced a heavy rainfall event that resulted in flooding of the Goulburn River and surrounding areas.
UWS analysed the intensity and distribution of this event and compared it to previous large rainfall events that occurred in October and December 2023, where spatial rainfall variability across the catchment was also observed.
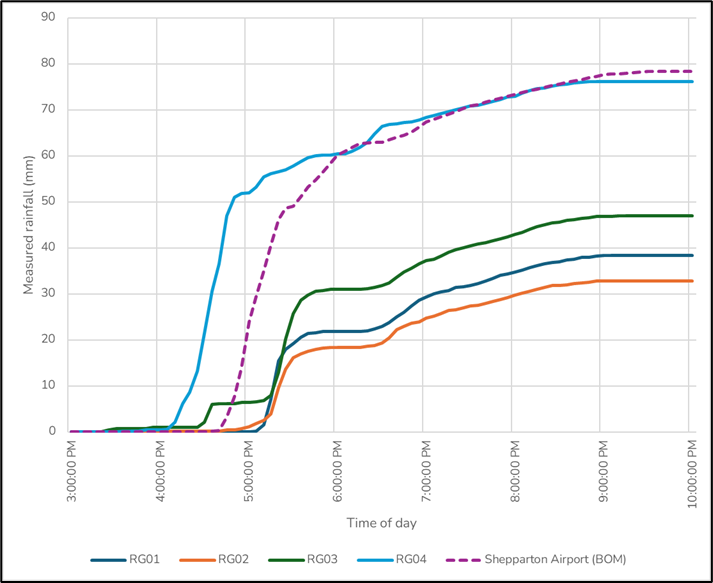
Figure 2 shows the total rainfall recorded by each of the gauges during the storm. It also shows the 30-minute data from the nearest BOM gauge for comparison.
RG04 (the blue line) recorded much higher rainfall than the other three gauges, and most of this rainfall happened about 1 hour earlier at RG04, than the BOM gauge (purple line) and the three gauges located further north. The BOM data also shows the wind was blowing 81 km/hr from the south-south west at around 4pm on 2 January, which matches the observation of a storm moving northward over Shepparton.
The four rain gauges installed by UWS recorded different magnitudes of rainfall during this event, showing significant spatial and temporal rainfall variability across the Shepparton township.
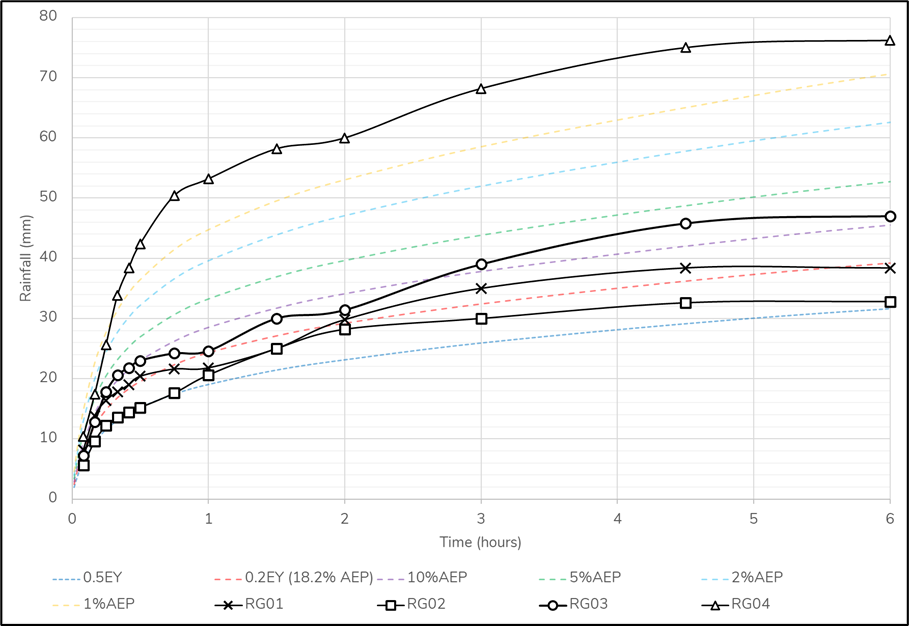
This difference in recorded rainfall affected the estimated Annual Exceedance Probability (AEP) of the event. Figure 3 shows the intensity-frequency-duration (IFD) plots of the rainfall measured at the four gauges in Shepparton.
For the 2 January 2024 storm rain gauge RG04 recorded an event larger than a 1% AEP storm event. Whereas the other three gauges all recorded events smaller than a 5% AEP, with RG02 recording a smaller event than a 20% AEP.
Comparison to 24-25 December 2023
Different storms have different amounts of spatial and temporal variance. For example, the storm that occurred on 24-25 December had less spatial variance across the catchment compared to that observed on 2 January. This was a much longer rainfall event, lasting 15 hours.
Figure 4 shows the total rainfall at each of the gauges during the storm. For this event more rain fell on the northern part of Shepparton, with RG04 in the south, recording approximately 20% less rainfall.
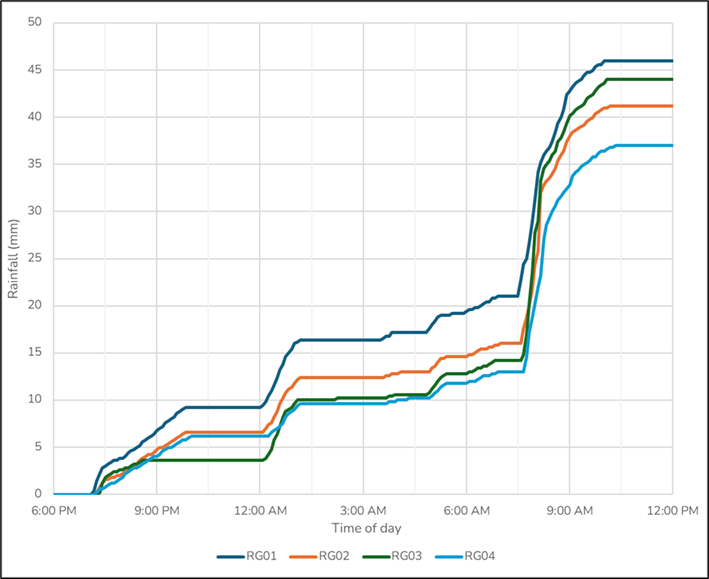
While in this event RG04 does record somewhat less rainfall than the other three gauges, the differential is much smaller than that recorded for the 2 January event. Further, the rainfall spikes are close to simultaneous at all the monitors which is not the case for the 2 January event.
Conclusion
The data from these rain gauges illustrates the spatial variability of rainfall events that can occur across relatively small catchments. This is important when attempting to calibrate hydrologic models as only having one rainfall gauge removes this level of detail. For the 2 January rainfall event the observed data in the south of Shepparton was twice that recorded in the north. The AEP can range from 10% to greater than 1% AEP in the south of Shepparton, which is a very large difference.
This large difference in rainfall explains why the sewerage network in the south of Shepparton was heavily impacted during the 2 January rainfall event.
Access to accurate rainfall data, with both a high spatial and temporal resolution, allows GVW to assess the effects of different types of storms more accurately on the sewerage network. Additionally, a greater spatial resolution for rainfall data allows operations teams to respond to high flow events more effectively in targeted areas of the sewerage network.